Lesson 2: Causes of Death
Download a zip file containing data for Lesson 2 in Excel and CSV formats.
2.1 Age-Specific Death Rate (ASDR)
Formula 1 (1)
Example
A hypothetical country reported the following data:
- Number of deaths in the age group 50-55 in 1998 = 1513
- Estimated 1998 mid-year population in the age group 50-55 = 146,605
The age-specific death rate for the age group 50-55 in 1998 is calculated using formula (1) above as:

Notation
In this lesson we will denote the age-specific death rate as:

Note the subscripts in the notation: x stands for the beginning age of the age group and n stands for the length of the age interval.
Using this notation, the age-specific death rate for the age group 50-55 is
Effect of the Multiplier
Note that the age-specific death rate in formula (1) has multiplier 1000. The resulting rate is interpreted as number of deaths in a year per 1000 people in the age group.
In the computation of life table quantities, the rates are usually expressed as deaths in a year per person in the age group. This means that the rate will not be multiplied by 1000 as in formula (1).
2.2 Age-Cause-Specific Death Rate (ACSDRate)
Formula (2)

|
Example In the hypothetical country considered in the previous example, the number of deaths in the age group 50-55 due to cardiovascular disease in 1998 is reported to be 345. Using formula (2), one can calculate the age-cause-specific death rate for cardiovascular disease for the age group as:  |
Notation for age-cause-specific death rate
As in age-specific death rate, use the following notation:

due to a specific cause
Note that a specific cause is denoted as 
2.3 Age-Cause-Specific Death Ratio (ACSDRatio)
Formula (3)
|
Example In the hypothetical country referred to in the two previous examples, there were 1513 deaths in the age group 50-55 in 1998. Among these deaths, 345 were due to cardiovascular disease. The age-cause-specific death ratio for cardiovascular deaths in the age group 50-55 is calculated using formula (3) as: This ratio indicates that in 1998 for the hypothetical country considered, 22.8% of all deaths in the age group 50-55 were due to cardiovascular disease. |
Notation for age-cause-specific death ratio:


Exercise 3
Question 1
If last year a region in your country had an age-specific death rate of 4.4 per 1000 people in the age group 20-24, and the mid-year population for that group was 50,000, how many deaths occurred in that group last year?
- 440
- 220
- 50
- 500
Question 2
If half of the deaths in Question 1 were due to a deadly epidemic, what is the age-cause-specific death rate (ACSDRate) for that epidemic?
- 5.0
- 1.1
- 50.0
- 2.2
Question 3
If 11 of the deaths in Question 1 were due to dysentery, what is the age-cause-specific death ratio (ACSDRatio) for dysentery?
- 5.0%
- 15.0%
- 2.2%
- 11.0%
2.4 Relationships among ASDR, ACSDRate, and ACSDRatio
Age-Specific Death Rate and Age-Cause-Specific Death Rate
Recall that total number of deaths in an age group is the sum of deaths due to each cause. Suppose there are rcauses of death operating in a population. Then in a specific age group:
Total deaths in the age interval = deaths due to cause 1 + deaths due to cause 2 +...+ deaths due to cause r.
When we divide both sides of the above equation by the mid-year population of the age group we get:

The equation above shows that the age-specific death rate is equal to the sum of the age-cause-specific death rates in that age interval.
In the notations given above, this relation can be expressed as:

Age-Specific Death Rate, Age-Cause-Specific Death Rate, and Age-Cause-Specific Death Ratio
Remember that the age-cause-specific death ratio is defined as the percentage of deaths due to a particular cause among all deaths in the age interval. This ratio can also be expressed as the ratio of an age-cause-specific death rate and the age-specific death rate:

Because both age-specific death rate and age-cause-specific death rate have mid-year population as the denominator, the ratio on the right-hand side reduces to the ratio of the age-cause-specific death rate to total deaths in the age interval.
When published reports provide the age-specific death rate and the age-cause-specific death rate, you can use those numbers to obtain the age-cause-specific death ratio.
In the notations introduced above:
Age-cause-specific death ratio
Also note that the age-cause-specific death rate can be obtained from the age-specific death rate by multiplying the age-specific death rate by the corresponding age-cause-specific death ratio:

Cautionary Note
The advantage of the age-cause-specific death ratio is that it does not require knowledge of the mid-year population in computing it. Therefore, it is often seen as a measure of relative significance of causes of death across subgroups of a population. The age-cause-specific death rate is considered a measure of occurrence of death and is used to compute relative risk of death from a specific cause 
However, one needs to be careful in interpreting the age-cause-specific death ratio and age-cause-specific death rate. The following hypothetical example for cancer mortality will illustrate this point. In a hypothetical country, age-specific death rates and age-cause-specific death ratios for cancer death for the age groups 55-64 and 65-74 in a given year are as follows:
Table 2.4.1: Hypothetical Rates vs. Ratios
|
||
| Age Group | ||
|---|---|---|
| 55-64 | 65-74 | |
| Cause-Specific Death Rate per 100,000 people (Cancer) |
448.4 | 871.6 |
| Cause-Specific Death Ratio (Cancer) | 38.0 | 33.0 |
The data show that while the incidence of death from cancer is higher in the 65-74 age group than in the 55-64 age group, the ratio of cancer deaths relative to other cause-specific death ratios is smaller in that group. These data show that the cause-specific death rate is not always a good indicator of relative risk and in order to identify causes of death in specific subgroups as priorities for research or prevention, it is necessary to examine both the ratio and rate of occurrence.
Exercise 4
This is an open-ended question to stimulate thinking. Write down your own answer before you look at the answer key.
Assume you are presenting your research to government officials to help them determine the number one reason a child might not survive its first year of life. In this lesson, you have learned about three different summary measures describing causes of death. Which of these measures would you focus on in your presentation and why?
After writing down your answer, see the answer key below and discussion.
2.5 An Example with Real Data
In this section we look at data from Costa Rican males in 1960 and learn to compute age-cause-specific death rates and age-cause-specific death ratios.
The basic data needed to compute the age-cause-specific death rates and age-cause-specific death ratios are the mid-year population and the number of deaths by cause in specific age groups.
The data presented below are also available to download as a single zip file so students may examine and work with the data in their own spreadsheet software.
Table 2.5.1: Deaths by Cause and Mid-Year Population: 1960 Costa Rican Males
|
||||||
| Age Interval | Mid-Year Population | Deaths | Diarrhea | Cancer | CVD* | Other Causes |
|---|---|---|---|---|---|---|
| <1 year | 29,780 | 2,235 | 538 | 2 | 17 | 1,678 |
| 1-4 | 93,280 | 654 | 140 | 13 | 8 | 493 |
| 5-9 | 83,036 | 142 | 10 | 8 | 0 | 124 |
| 10-14 | 68,192 | 87 | 1 | 5 | 4 | 77 |
| 15-19 | 55,985 | 72 | 2 | 4 | 4 | 62 |
| 20-24 | 48188 | 87 | 0 | 6 | 7 | 74 |
| 25-29 | 40,996 | 67 | 0 | 7 | 4 | 56 |
| 30-34 | 35,390 | 70 | 2 | 4 | 6 | 58 |
| 35-39 | 28,499 | 86 | 2 | 10 | 10 | 64 |
| 40-44 | 23,319 | 103 | 1 | 23 | 13 | 66 |
| 45-49 | 21,074 | 136 | 0 | 20 | 28 | 88 |
| 50-54 | 17,231 | 159 | 3 | 46 | 33 | 77 |
| 55-59 | 13,098 | 176 | 2 | 55 | 44 | 75 |
| 60-64 | 9,858 | 233 | 4 | 74 | 64 | 91 |
| 65-69 | 6,772 | 246 | 3 | 62 | 78 | 103 |
| 70-74 | 4,747 | 246 | 5 | 47 | 95 | 99 |
| 75-79 | 2,878 | 220 | 3 | 44 | 69 | 104 |
| 80-84 | 1,250 | 169 | 5 | 23 | 62 | 79 |
| 85+ | 457 | 154 | 5 | 13 | 55 | 81 |
| *CVD = Cardiovascular Disease | ||||||
| Source: Preston, et al. (1972) | ||||||
Age-Cause-Specific Death Rates
Data in Table 2.5.1 can be used to compute the age-cause-specific death rates by simply dividing the number of deaths by cause in a particular age group by the corresponding mid-year population and multiplying by 1000. The resulting calculations are given in Table 2.5.2.
Table 2.5.2: Age-Cause-Specific Death Rates: 1960 Costa Rican Males
|
|||||
| Age Interval | All Causes | Diarrhea | Cancer | CVD | Other Causes |
|---|---|---|---|---|---|
| Death Rates per 1000 People | |||||
| <1 year | 75.05037 | 18.06582 | 0.06716 | 0.57085 | 56.34654 |
| 1-4 | 7.01115 | 1.50086 | 0.13937 | 0.08576 | 5.28516 |
| 5-9 | 1.71010 | 0.12043 | 0.09634 | 0.00000 | 1.49333 |
| 10-14 | 1.27581 | 0.01466 | 0.07332 | 0.05866 | 1.12916 |
| 15-19 | 1.28606 | 0.03572 | 0.07145 | 0.07145 | 1.10744 |
| 20-24 | 1.80543 | 0.00000 | 0.12451 | 0.14526 | 1.53565 |
| 25-29 | 1.63431 | 0.00000 | 0.17075 | 0.09757 | 1.36599 |
| 30-34 | 1.97796 | 0.05651 | 0.11303 | 0.16954 | 1.63888 |
| 35-39 | 3.01765 | 0.07018 | 0.35089 | 0.35089 | 2.24569 |
| 40-44 | 4.41700 | 0.04288 | 0.98632 | 0.55749 | 2.83031 |
| 45-49 | 6.45345 | 0.00000 | 0.94904 | 1.32865 | 4.17576 |
| 50-54 | 9.22755 | 0.17410 | 2.66961 | 1.91515 | 4.46869 |
| 55-59 | 13.43717 | 0.15270 | 4.19911 | 3.35929 | 5.72607 |
| 60-64 | 23.63563 | 0.40576 | 7.50659 | 6.49219 | 9.23108 |
| 65-69 | 36.32605 | 0.44300 | 9.15535 | 11.51802 | 15.20969 |
| 70-74 | 51.82220 | 1.05330 | 9.90099 | 20.01264 | 20.85528 |
| 75-79 | 76.44197 | 1.04239 | 15.28839 | 23.97498 | 36.13621 |
| 80-84 | 135.20000 | 4.00000 | 18.40000 | 49.60000 | 63.20000 |
| 85+ | 336.98031 | 10.94092 | 28.44639 | 120.35011 | 177.24289 |
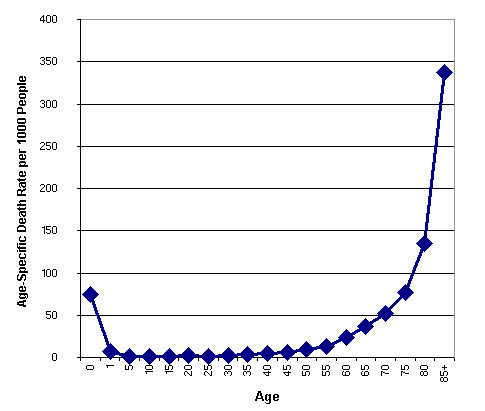
Figure 2.5.1 below shows the age patterns of mortality in the population. Note that it is a U-shaped (or J-shaped) curve with high infant mortality and high death rates at older ages.
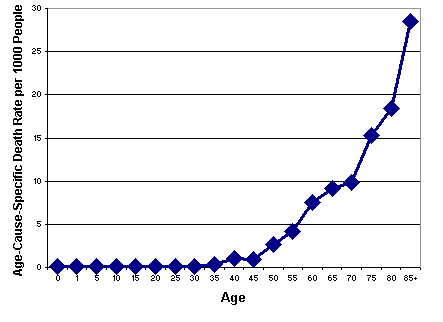
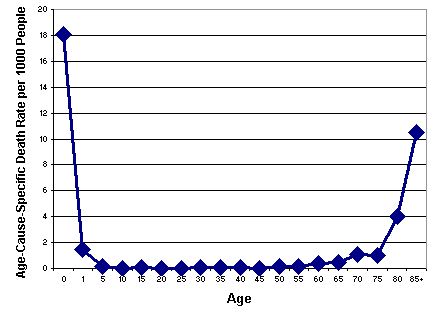
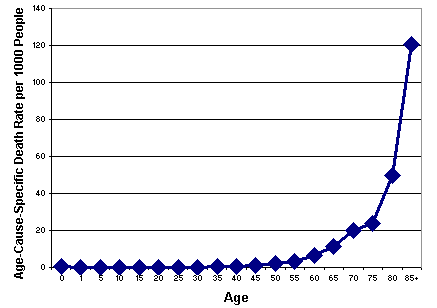
Figures 2.5.2 - 2.5.4 below show the age pattern of mortality for various causes in the population. Note the difference in the shape of the curves. The curves for cancer and CVD mortality show a steady increase with age. The diarrhea mortality is very high among the youngest and oldest groups.
Figure 2.5.3: Diarrhea Mortality Pattern across the Life Span: 1960 Costa Rican Males
Figure 2.5.4: CVD Mortality Pattern across the Life Span: 1960 Costa Rican Males
Age-Cause-Specific Death Ratios
We use the data in Table 2.5.1 to compute the age-specific death ratios. They are computed by dividing the number of deaths due to a specific cause by the total deaths in the same interval (and multiplying by 100). Table 2.5.3 shows the computed age-cause-specific death ratios for 1960 Costa Rican males.
Table 2.5.3: Age-Cause-Specific Death Ratios: 1960 Costa Rican Males |
||||
| Age Interval | Diarrhea | Cancer | CVD | Other Causes |
|---|---|---|---|---|
| <1 year | 24.07159 | 0.08949 | 0.76063 | 75.07830 |
| 1-4 | 21.40673 | 1.98777 | 1.22324 | 75.38226 |
| 5-9 | 7.04225 | 5.63380 | 0.00000 | 87.32394 |
| 10-14 | 1.14943 | 5.74713 | 4.59770 | 88.50575 |
| 15-19 | 2.77778 | 5.55556 | 5.55556 | 86.11111 |
| 20-24 | 0.00000 | 6.89655 | 8.04598 | 85.05747 |
| 25-29 | 0.00000 | 10.44776 | 5.97015 | 83.58209 |
| 30-34 | 2.85714 | 5.71429 | 8.57143 | 82.85714 |
| 35-39 | 2.32558 | 11.62791 | 11.62791 | 74.41860 |
| 40-44 | 0.97087 | 22.33010 | 12.62136 | 64.07767 |
| 45-49 | 0.00000 | 14.70588 | 20.58824 | 64.70588 |
| 50-54 | 1.88679 | 28.93082 | 20.75472 | 48.42767 |
| 55-59 | 1.13636 | 31.25000 | 25.00000 | 42.61364 |
| 60-64 | 1.71674 | 31.75966 | 27.46781 | 39.05579 |
| 65-69 | 1.21951 | 25.20325 | 31.70732 | 41.86992 |
| 70-74 | 2.03252 | 19.10569 | 38.61789 | 40.24390 |
| 75-79 | 1.36364 | 20.00000 | 31.36364 | 47.27273 |
| 80-84 | 2.95858 | 13.60947 | 36.68639 | 46.74556 |
| 85+ | 3.24675 | 8.44156 | 35.71429 | 52.59740 |
Table 2.5.3 shows the relative significance of various diseases at specific age intervals. It clearly shows that among children, diarrhea is the leading cause of death, while among the elderly, deaths by cardiovascular disease are most common.
Exercise 5
Note to students: This exercise is lengthy but essential to the mastery of these concepts. Work through these examples on your own. Just reading this material will not be enough. Good luck!
Use the data on "Age-Specific Deaths by Cause for 1960 Costa Rican Females."
Using your spreadsheet software, do the following with the data you have downloaded:
- Compute age-specific death rates (overall and for each cause).
- Compute age-specific death ratios (for each cause).
- Draw graphs of age-specific death rates and age-cause-specific death rates.
- Describe the age patterns of mortality (overall and for each cause).
- Describe the relative significance of the three causes of death in two age intervals: 1-4 and 85+.
The data in your spreadsheet should look something like this:
Table 2.5.4, Exercise 5: Age-Specific Deaths by Cause: 1960 Costa Rican Females |
|||||
| Age Interval | Mid-Year Population | Deaths | Diarrhea | Cancer | CVD |
|---|---|---|---|---|---|
| <1 year | 28661 | 1834 | 476 | 5 | 11 |
| 1-4 | 90412 | 695 | 158 | 6 | 12 |
| 5-9 | 80892 | 136 | 12 | 3 | 8 |
| 10-14 | 66080 | 63 | 33 | 3 | 5 |
| 15-19 | 54702 | 46 | 11 | 1 | 6 |
| 20-24 | 48077 | 61 | 10 | 11 | 7 |
| 25-29 | 43331 | 76 | 0 | 6 | 11 |
| 30-34 | 37918 | 86 | 1 | 10 | 16 |
| 35-39 | 29771 | 82 | 0 | 18 | 12 |
| 40-44 | 23843 | 70 | 2 | 17 | 11 |
| 45-49 | 21554 | 100 | 0 | 36 | 24 |
| 50-54 | 17493 | 122 | 2 | 42 | 28 |
| 55-59 | 13065 | 137 | 1 | 47 | 45 |
| 60-64 | 9906 | 186 | 2 | 55 | 64 |
| 65-69 | 6848 | 197 | 3 | 49 | 67 |
| 70-74 | 4742 | 219 | 5 | 46 | 66 |
| 75-79 | 2819 | 191 | 5 | 27 | 61 |
| 80-84 | 1242 | 165 | 4 | 23 | 53 |
| 85+ | 806 | 255 | 4 | 1 | 90 |
After you have completed the exercise, compare your calculations, graphs, and descriptions to the answer key below.
Answers to Exercises
Exercise 3
Question 1
If last year a region in your country had an age-specific death rate of 4.4 per 1000 people in the age group 20-24, and the mid-year population for that group was 50,000, how many deaths occurred in that group last year?
B. 220, calculated as follows (solving for X, the number of deaths):
|
ASDR(20-24) =
|
(X / 50,000) * 1000 = 4.4 |
|
=
|
1000X / 50,000 = 4.4 |
|
=
|
X / 50 = 4.4 |
|
=
|
X = 4.4 * 50 |
|
=
|
X = 220 |
Exercise 3
Question 2
If half of the deaths in Question 1 were due to a deadly epidemic, what is the age-cause-specific death rate (ACSDRate) for that epidemic?
B. 2.2. Just as 220 deaths produced an ASDR(20-24) of 4.4, then the 110 deaths due to the epidemic yield an age-cause-specific death rate of 2.2 (half of 4.4).
Exercise 3
Question 3
If 11 of the deaths in Question 1 were due to dysentery, what is the age-cause-specific death ratio (ACSDRatio) for dysentery?
A. 5.0%. The age-cause-specific death ratio is the percentage of all the deaths were due to a particular cause. If 11 out of the 220 deaths were due to dysentery, then 5% (11/220 = .05) of the deaths were due to dysentery.
Exercise 4
Assume you are presenting your research to government officials to help them determine the number one reason a child might not survive its first year of life. In this lesson, you have learned about three different summary measures describing causes of death. Which of these measures would you focus on in your presentation and why?
Answer: The age-cause-specific death rate (ACSDRate) for all the major causes would reveal which cause is producing the most deaths; this is an acceptable answer.
The best answer would be the age-cause-specific death ratios (ACSDRatios) for all the major causes. Not only would ACSDRatios demonstrate (in easy-to-understand percentages) which cause is number one, they would also show the significance of the number one cause in relation to other causes.
The age-specific death rate (ASDR) for age group 0-1 measures overall infant mortality from all causes. ASDR would not distinguish among causes of death; therefore it is not a correct answer.
Exercise 5
Using your spreadsheet software, do the following with the data you have downloaded:
- Compute age-specific death rates (overall and for each cause).
- Compute age-specific death ratios (for each cause).
- Draw graphs of age-specific death rates and age-cause-specific death rates.
- Describe the age patterns of mortality (overall and for each cause)
- Describe the relative significance of the three causes of death in two age intervals: 1-4 and 85+.
1. Compute age-specific death rates (overall and for each cause).
Exercise 5, Answer Key: Age-Cause-Specific Death Rates: 1960 Costa Rican Females
|
||||
| Age Interval | All Causes | Diarrhea | Cancer | CVD |
|---|---|---|---|---|
| <1 year | 63.98939 | 16.60793 | 0.17445 | 0.38380 |
| 1-4 | 7.68703 | 1.74756 | 0.06636 | 0.13273 |
| 5-9 | 1.68125 | 0.14835 | 0.03709 | 0.09890 |
| 10-14 | 0.95339 | 0.49939 | 0.04540 | 0.07567 |
| 15-19 | 0.84092 | 0.20109 | 0.01828 | 0.10969 |
| 20-24 | 1.26880 | 0.20800 | 0.22880 | 0.14560 |
| 25-29 | 1.75394 | 0.00000 | 0.13847 | 0.25386 |
| 30-34 | 2.26805 | 0.02637 | 0.26373 | 0.42196 |
| 35-39 | 2.75436 | 0.00000 | 0.60462 | 0.40308 |
| 40-44 | 2.93587 | 0.08388 | 0.71300 | 0.46135 |
| 45-49 | 4.63951 | 0.00000 | 1.67022 | 1.11348 |
| 50-54 | 6.97422 | 0.11433 | 2.40096 | 1.60064 |
| 55-59 | 10.48603 | 0.07654 | 3.59740 | 3.44432 |
| 60-64 | 18.77650 | 0.20190 | 5.55219 | 6.46073 |
| 65-69 | 28.76752 | 0.43808 | 7.15537 | 9.78388 |
| 70-74 | 46.18305 | 1.05441 | 9.70055 | 13.91818 |
| 75-79 | 67.75452 | 1.77368 | 9.57786 | 21.63888 |
| 80-84 | 132.85024 | 3.22061 | 18.51852 | 42.67311 |
| 85+ | 316.37717 | 4.96278 | 1.24069 | 111.66253 |
2. Compute age-specific death ratios (for each cause).
|
Exercise 5, Answer Key: Age-Cause-Specific Death Ratios: 1960 Costa Rican Females
|
|||||
| Age Interval | Diarrhea | Cancer | CVD | All Other Causes | |
|---|---|---|---|---|---|
| <1 year | 25.95420 | 0.27263 | 0.59978 | 73.17339 | |
| 1-4 | 22.73381 | 0.86331 | 1.72662 | 74.67626 | |
| 5-9 | 8.82353 | 2.20588 | 5.88235 | 83.08824 | |
| 10-14 | 52.38095 | 4.76190 | 7.93651 | 34.92063 | |
| 15-19 | 23.91304 | 2.17391 | 13.04348 | 60.86957 | |
| 20-24 | 16.39344 | 18.03279 | 11.47541 | 54.09836 | |
| 25-29 | 0.00000 | 7.89474 | 14.47368 | 77.63158 | |
| 30-34 | 1.16279 | 11.62791 | 18.60465 | 68.60465 | |
| 35-39 | 0.00000 | 21.95122 | 14.63415 | 63.41463 | |
| 40-44 | 2.85714 | 24.28571 | 15.71429 | 57.14286 | |
| 45-49 | 0.00000 | 36.00000 | 24.00000 | 40.00000 | |
| 50-54 | 1.63934 | 34.42623 | 22.95082 | 40.98361 | |
| 55-59 | 0.72993 | 34.30657 | 32.84672 | 32.11679 | |
| 60-64 | 1.07527 | 29.56989 | 34.40860 | 34.94624 | |
| 65-69 | 1.52284 | 24.87310 | 34.01015 | 39.59391 | |
| 70-74 | 2.28311 | 21.00457 | 30.13699 | 46.57534 | |
| 75-79 | 2.61780 | 14.13613 | 31.93717 | 51.30890 | |
| 80-84 | 2.42424 | 13.93939 | 32.12121 | 51.51515 | |
| 85+ | 1.56863 | 0.39216 | 35.29412 | 62.74510 | |
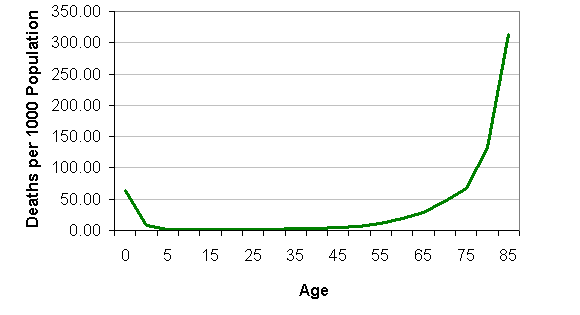
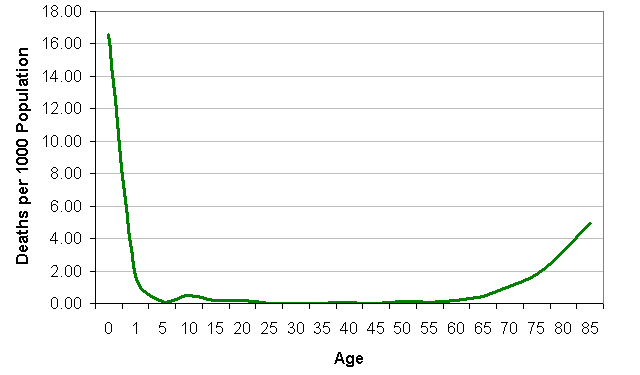
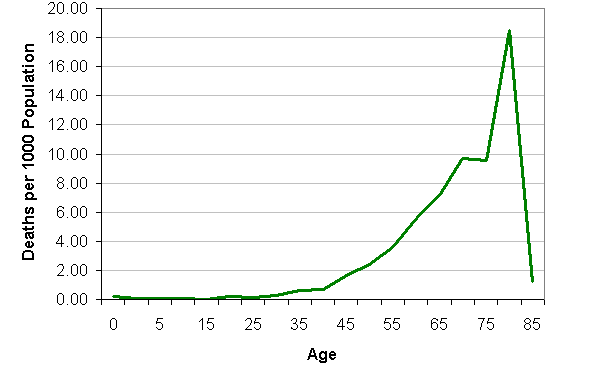
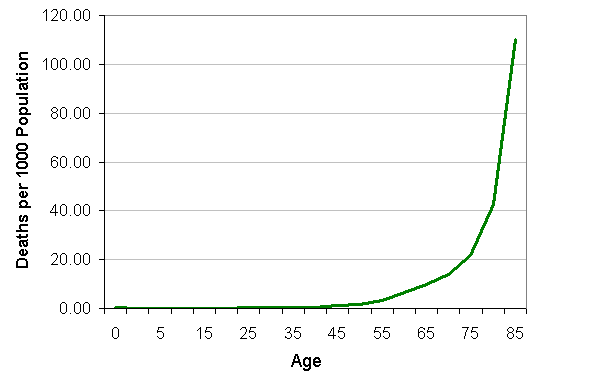
3. Draw graphs of age-specific death rates and age-cause-specific death rates.
Diarrhea Mortality Pattern across the Life Span: 1960 Costa Rican Females
Cancer Mortality Pattern across the Life Span: 1960 Costa Rican Females
CVD Mortality Pattern across the Life Span: 1960 Costa Rican Females
4. Describe the age patterns of mortality (overall and for each cause).
Overall mortality is high for children under 5 years old, low and flat from age 5 up to about age 45, and steadily increasing after that.
The highest mortality from diarrhea is that of children under 1 year old. Mortality from diarrhea remains very low from age 5 through age 69, then slowly increases.
Mortality from cancer is low until about age 30 when it starts rising. It increases sharply until age 84, when there is a sharp decline.
Mortality from CVD is low and flat until about age 45 and then it rises steadily and increases sharply at age 85.
5. Describe the relative significance of the three causes of death in two age intervals: 1-4 and 85+.
It helps to look at this graph of age-cause-specific death ratios:
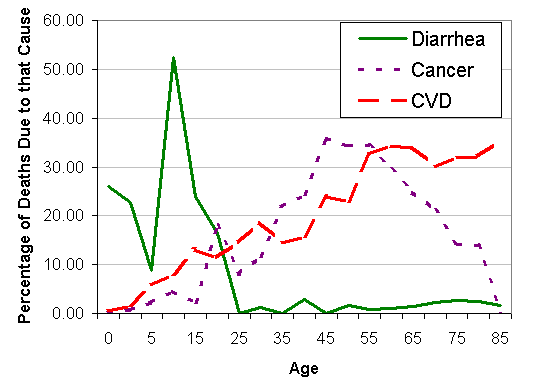
In the 1-4 age group, diarrhea is the most significant cause of death. In the 85+ group, CVD is by far the most significant.


